Install and Use htop in Ubuntu
Better than top? htop is a more user-friendly than top. It gives you an interactive interface to monitor system resource usage.

The top command is perhaps the top choice when it comes to system resource monitoring in Ubuntu command line.
Another important command that is very popular among system administrators is htop. It is a versatile and interactive task management application virtually found everywhere.
Let me show you how to install htop on Ubuntu and how to use it.
How to install htop in Ubuntu
htop is found in the official repositories of Ubuntu, so installing it is not a hard thing at all.
In order to get htop, you might also need ncurses package if it is not preinstalled. So, let us install both.
sudo apt install ncurses htopOnce done, you can start the htop by executing the following:
htopHow to use htop in Ubuntu
htop is an interactive task manager that updates the task list each second. You have a lot of flexibility with this task manager, and let me walk you through some of the essential ones.
The User interface
While the user interface looks plain in simple, you'd notice there are different colors for every progress bar. And trust me, it explains a lot!
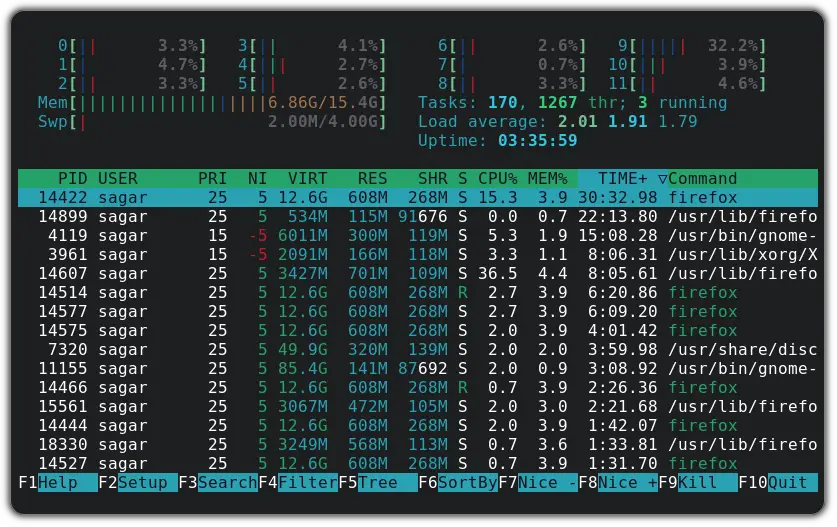
CPU usage:

CPU usage will show the total number of cores available in your system and will show the utilization of each one.
Then, why use different colors in the same bar? Here's the breakdown for each one:
- Green: Resources utilized by user processes
- Blue: It indicates low-priority threads
- Red: Resources that are used by system (kernel) processes
- Alpha Blue: Resources consumed by the virtualized processes
Memory bar

The memory bar gives you a broad perspective of how much of your system memory (RAM) and the swap memory are being utilized by the ongoing processes.
Now, let's have a look at what different colors indicates here:
- Green: Memory used by system processes
- Blue: Memory used by the buffer pages.
- Orange: Memory for the cache pages.
Statistics:

This is where things get interesting and this is the section that needs to be monitored the most when you are dealing with servers as you're given small amounts of resources to deal with.
- Tasks: This shows the total number of ongoing tasks (166 in my case).
- thr: Indicates the number of threads that are used to handle the processes. In my case, it shows 1249 threads are being utilized to manage 166 processes.
- running: Shows the number of ongoing tasks that are in the running state. In my case, it is 1.
- Load average: It indicates the average load over a period of time. As I have a Hexa-core processor, anything under 6.0 is good but if the number goes above, then, the upcoming process has to wait.
Now, let's have a look at the numbers associated with the Load average.
- 1.86: It is the load average of the last minute
- 1.75: It is the load average of the last 4 minutes
- 1.47: It is the load average of the last 15 minutes
Keybindings
Some of the keybindings are shown at the bottom of the screen, but still, let me list them out.
F1orh- Help screenF2- Setup screen (Configure the default behavior when you open htop)F3or/- Search for a task (while F3 combined with shift can navigate through the next or previous one)F4or\- Filter tasks (based on the search terms separated by| (pipe)F5ort- Switch between Tree view and List viewF6- Sort tasks by a parameter (Memory, CPU usage, Priority, etc)F7&F8- change the 'nice' value (changes the priority of the task; lower the nice value, higher the priority)F9- Kill a task with the desired signal (usually SIGTERM or SIGKILL)F10- Quit htop
Searching and Filtering tasks
Searching and filtering are different tasks. When you search for a task, you are locating it in the list, whereas when you filter tasks, all relevant ones are shown without the others.
When you are searching for a specific task, you can use either / or F3 keys and enter the search term.
It performs an incremental search, meaning the term will be located automatically as you enter each character.
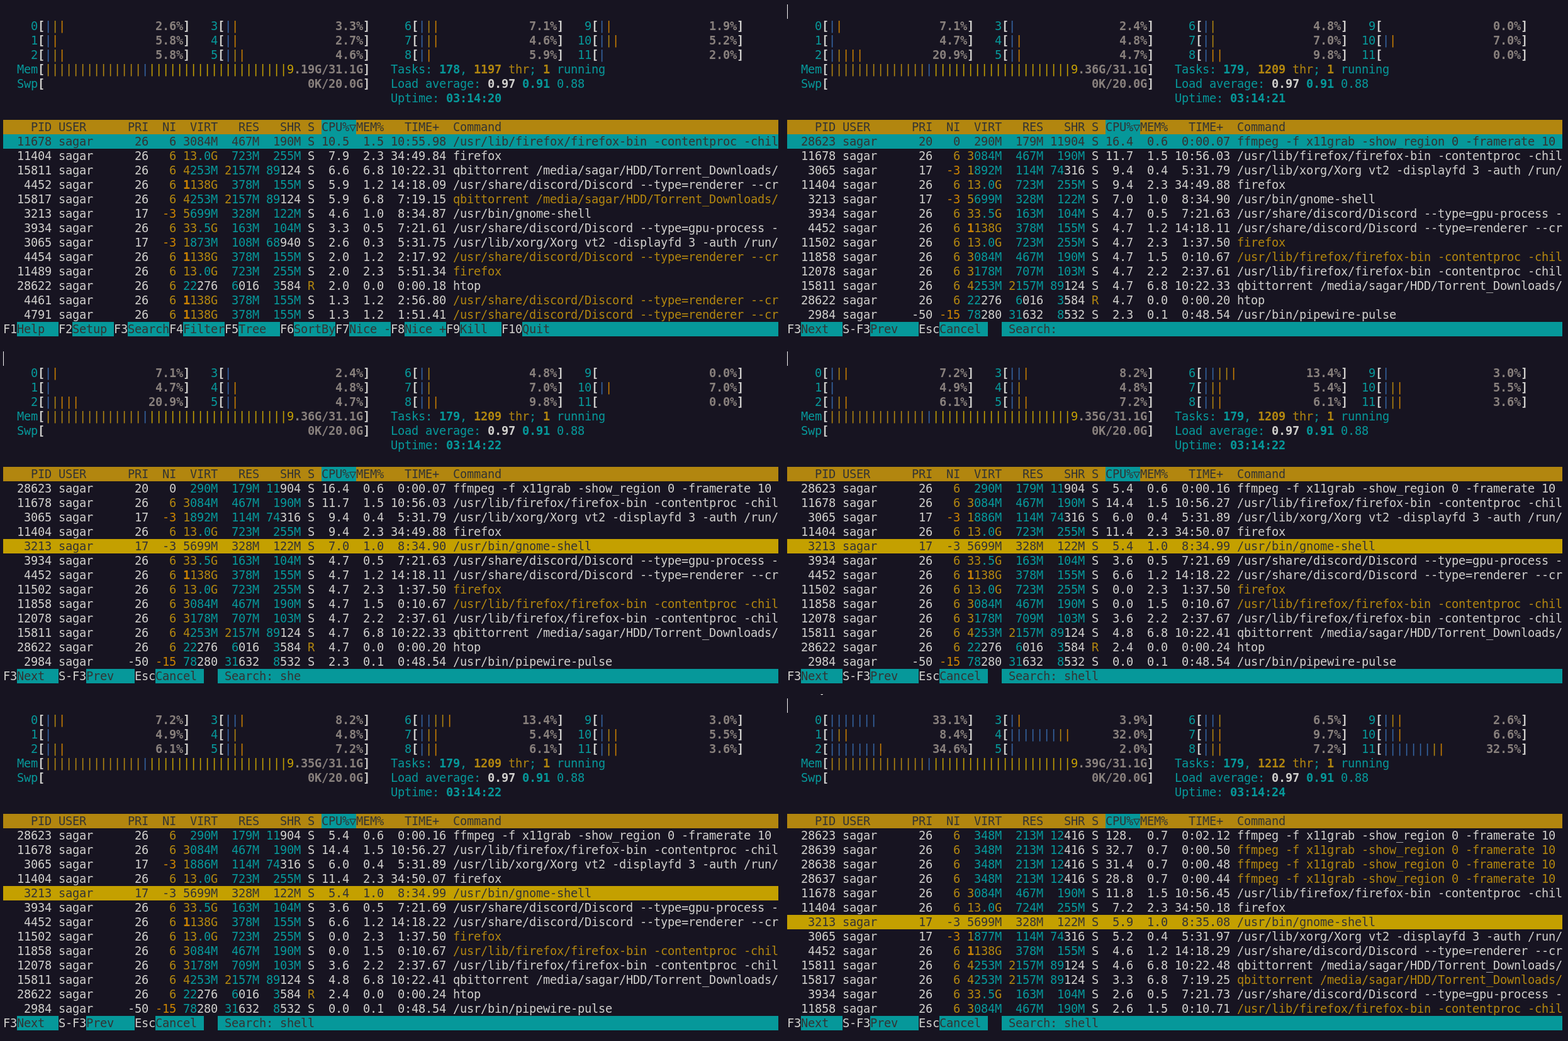
The first one on the list gets highlighted. Pressing F3 again (combined with Shift will switch to the next or previous entry).
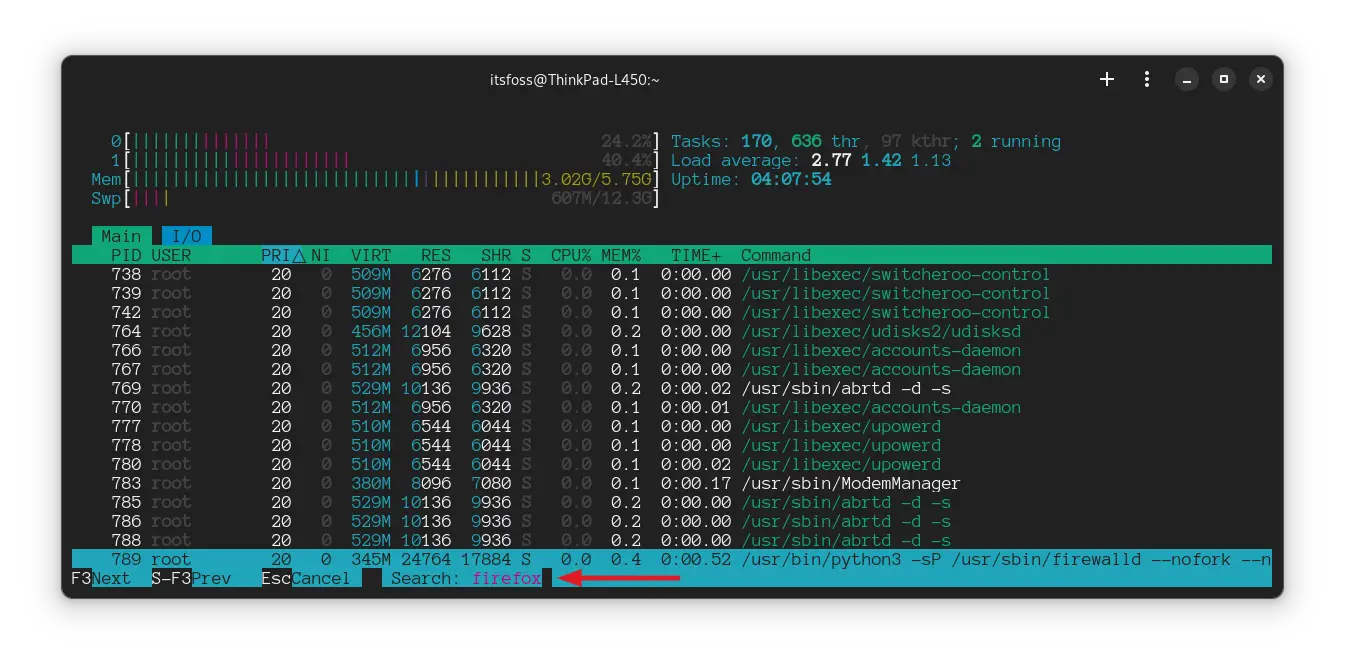
And if the text goes reddish in color when you enter a term that is not on the list:
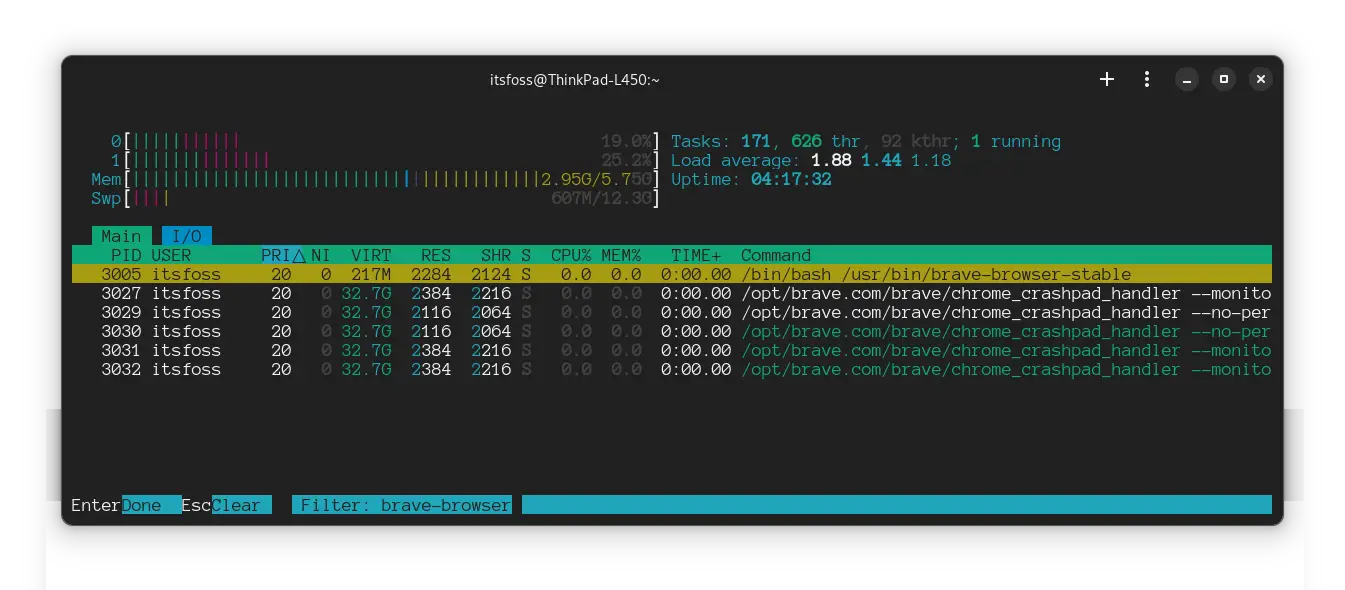
To use the filter, press the F4 key and the prompt will appear. Enter the filter term and the results will appear:
And if you are wondering about the difference between search and filter, here's the major advantage.
You can filter multiple terms, which can be separated by a pipe (|).
For example, here, I am filtering the SSH server and terminal instances as follows.
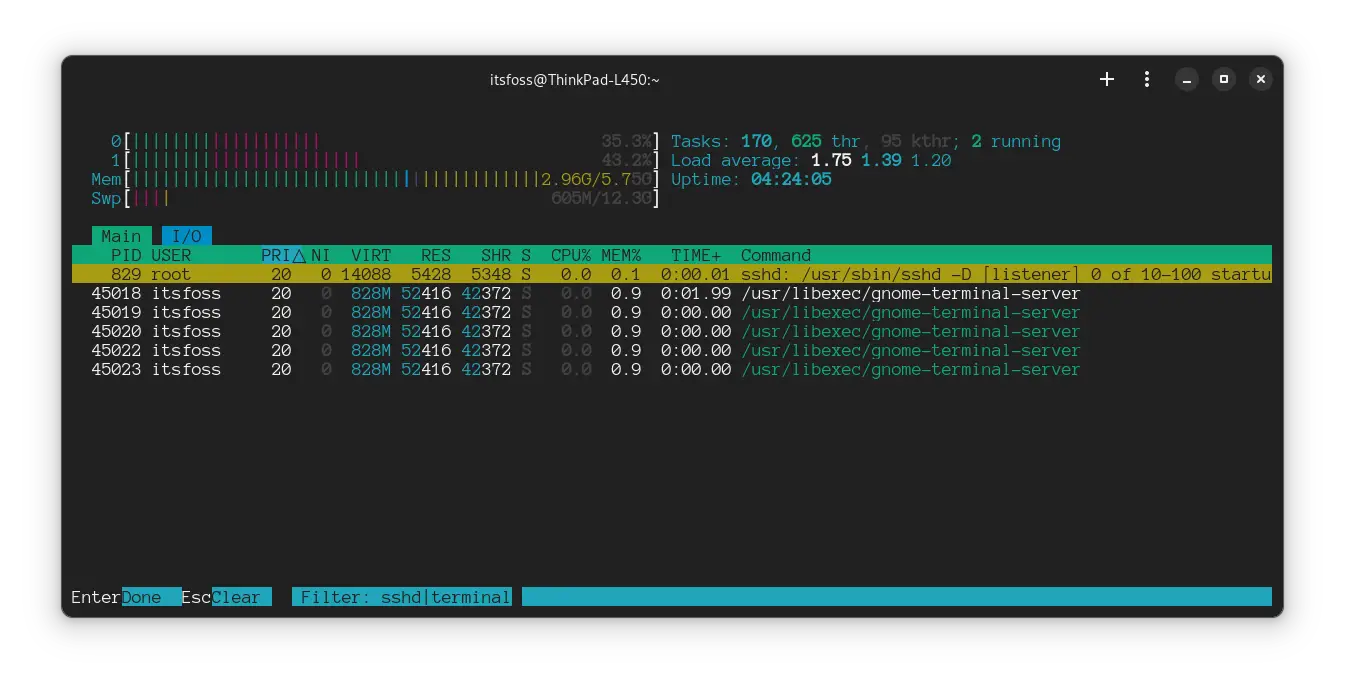
Clearing the filter requires pressing the Esc key in the filter dialog box.
Note that the search terms in both searching and filtering are not case-sensitive.
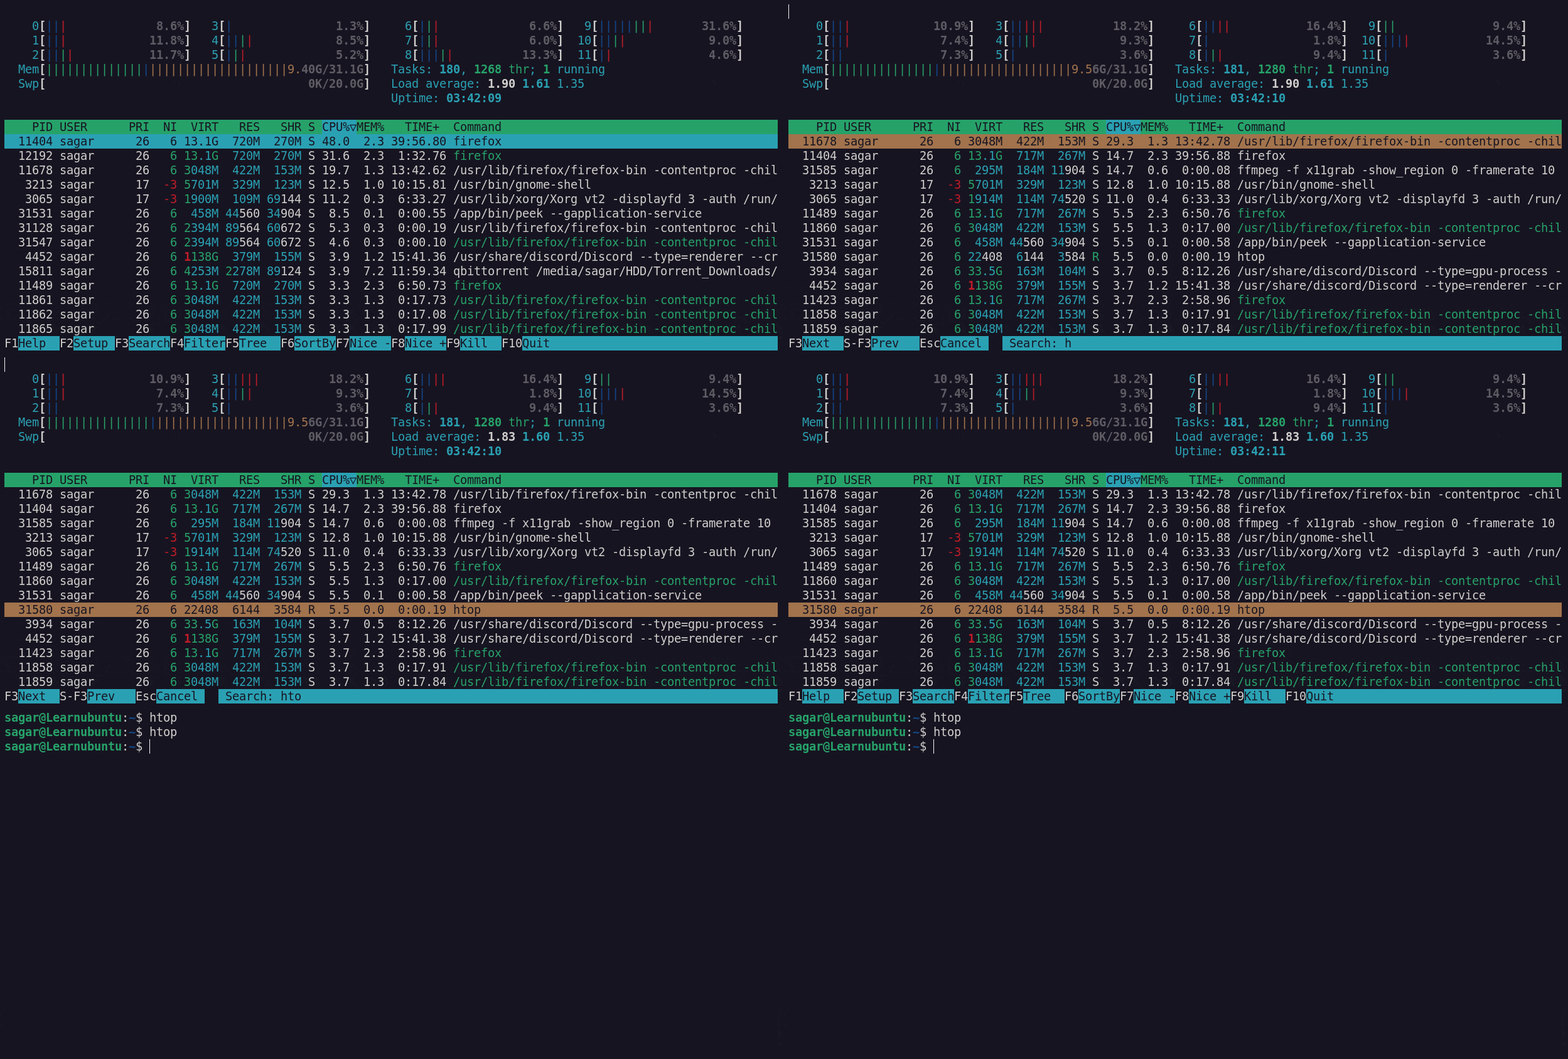
Killing processes using htop
To kill the process, follow the simple steps:
- Search for the process
- Once found the one you're looking for, hit enter and the process will be selected.
- Now, click on the
F9button and it will be the list of the different signals to kill the selected process. - You may choose a different process or hit enter again to go with the default (SIGTERM).
For example, here, I killed the htop itself:
Killing child and parent processes at once
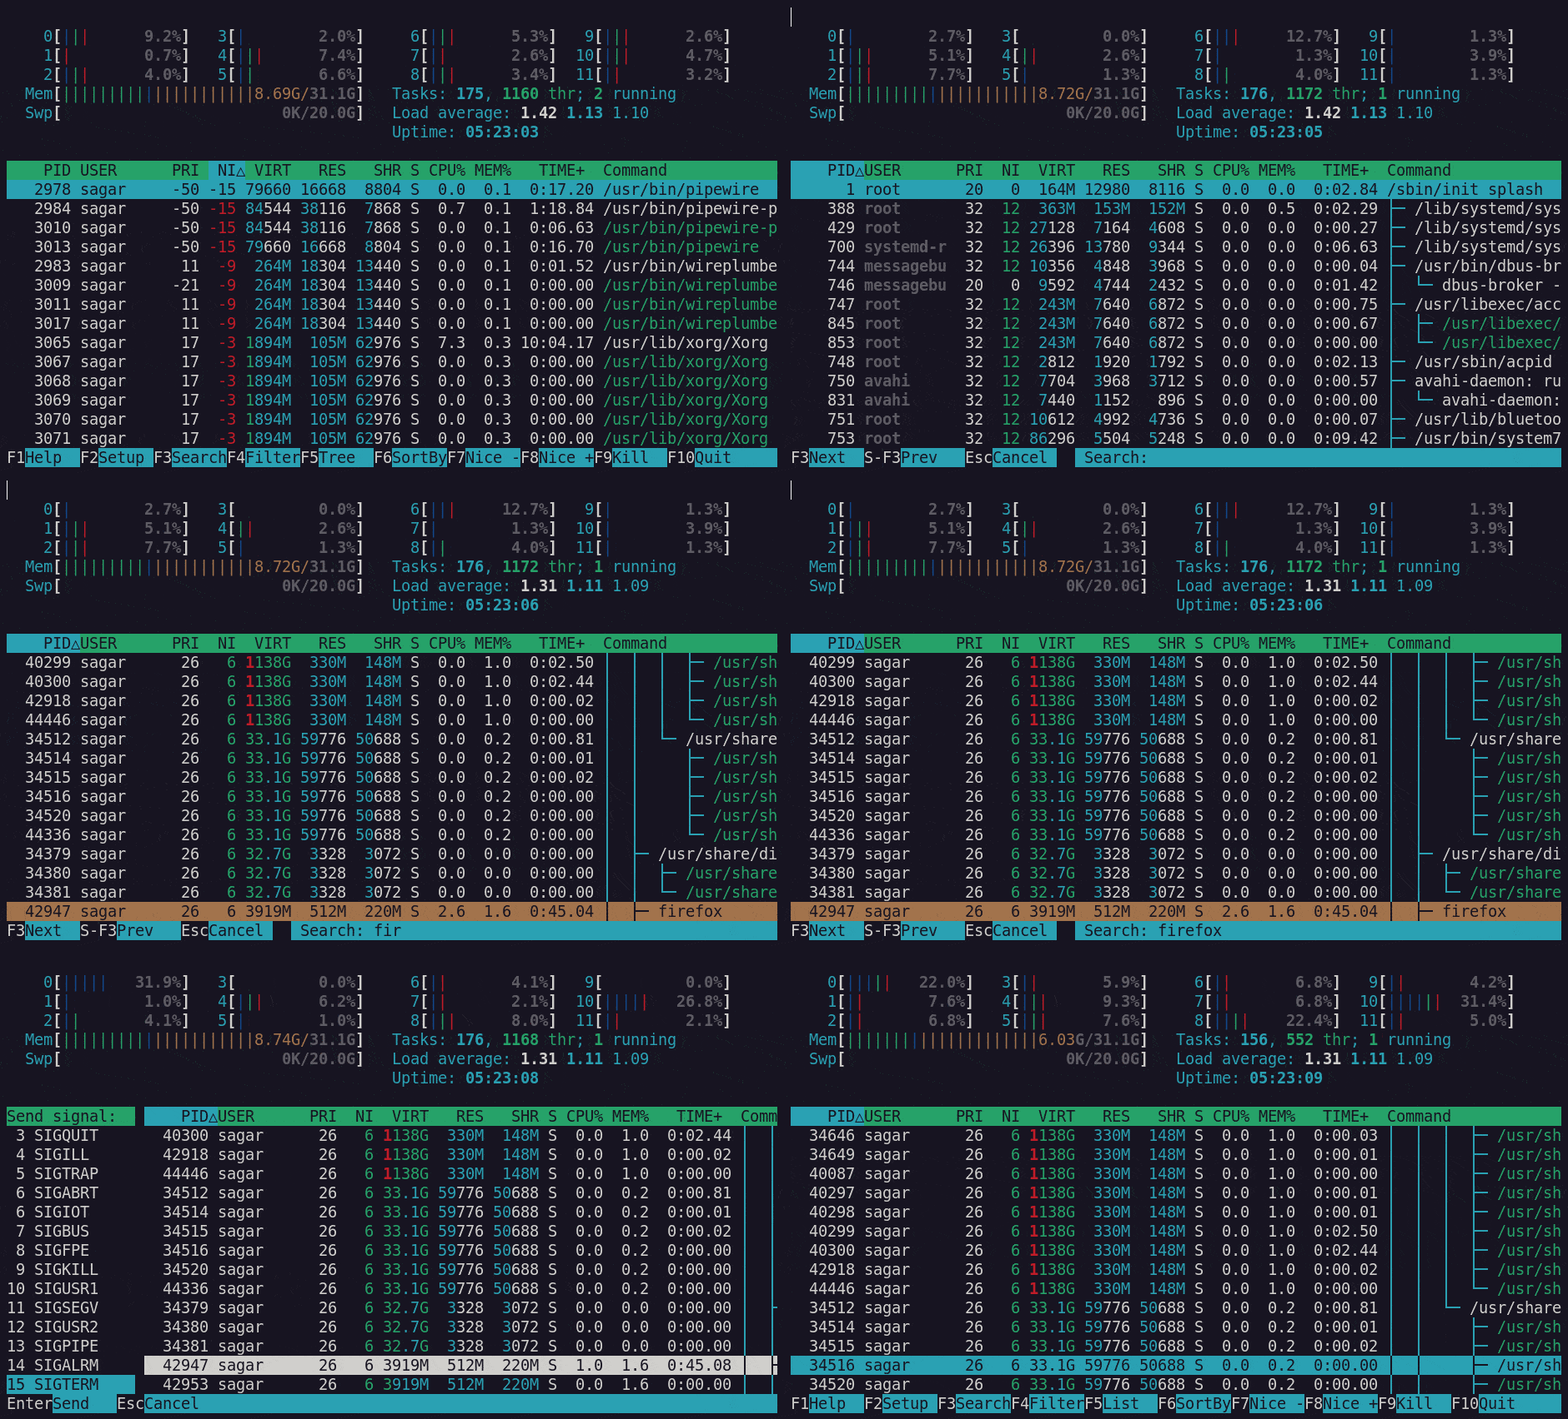
Killing the parent process will wipe the process from the root and you can be sure that the process is no longer running
To do so, follow the given steps:
- Switch to the tree view by pressing the
F5key - Search for the process and hit enter to select it
- Press
F9key to kill the selected process
For your reference, here's how I killed Firefox:
Learn more about the termination signals in Linux
If you are curious to learn more about the different use of the termination signals, we have a dedicated guide on that topic:

I hope you will find this guide helpful.
This is Pranav Krishna, a Proud Linux user in twelfth grade.
