Check CPU usage in Ubuntu
Learn how to check the CPU usage in Ubuntu command line.

When you are dealing with a server, resource management is the most crucial and that makes CPU usage monitoring an important task.
But the question is, how do you check the CPU usage in Ubuntu in the first place?
Well, there are multiple ways to do so, but in this tutorial, I will keep things simple and short.
How to check CPU usage in Ubuntu
While there are multiple tools to monitor CPU usage, I intend to list the most popular ones and not bloat your system with its dependencies.
So in this tutorial, I will walk you through the following:
- Using the top utility
- Using the mpstat command
1. Using the top utility
You'll find top available in almost every Linux distribution as if used correctly, it can give you tonnes of useful information.
And you can easily start the top utility using the following:
top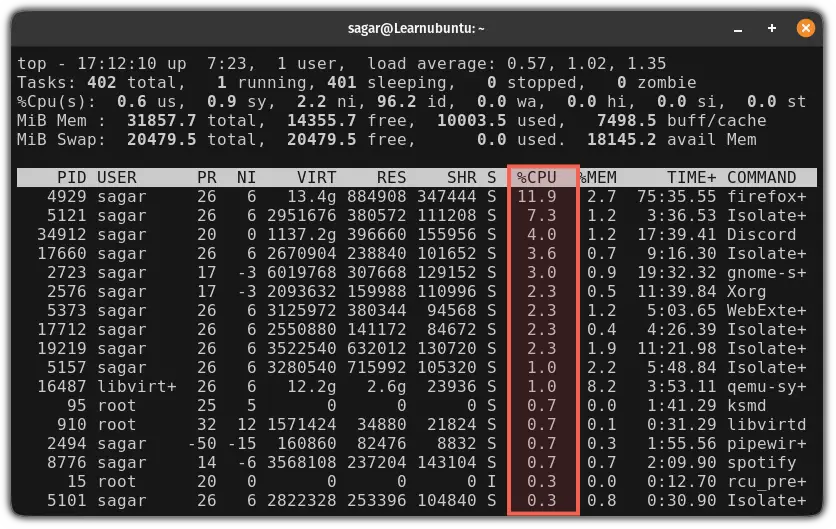
Take a look at the highlighted part in the above image, it shows the percentage of how much CPU resources are being utilized by a process.
But that's not the best yet.
You can use multiple commands inside the top to get much better output such as:
| Command | Description |
|---|---|
P |
Sort processes based on CPU usage |
M |
Sort processes based on Memory usage |
T |
Sort processes based on the run time |
N |
Sort processes based on the process ID |
Another tip is to start the top utility with the -i flag which will remove all the processes that are in an idle state that will eventually strip down the list:
top -i
2. Using the mpstat command
The mpstat command offers various statistics about CPU utilization which includes user time, idle time, and a lot more.
But unlike top, mpstat does not come pre-installed and for the installation, you'd have to install the sysstat package:
sudo apt install sysstat
Once done, you can start the mpstat using the following:
mpstat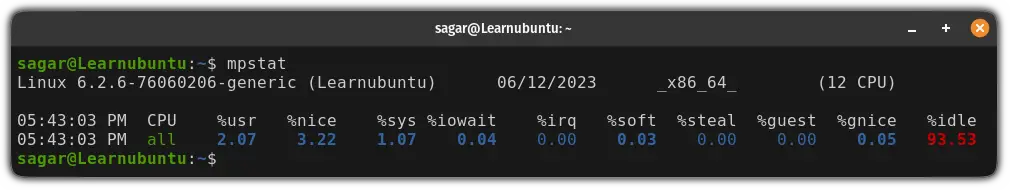
Looks too complex? Let me break it down for you:
CPU: Shows the number of specified cores to look for utilization, if specified none, it will showall, a combination of all the cores.%usr: CPU usage in user mode in percentage%.%nice: It indicates the CPU utilization of a user-level process with a nice priority.%sys: CPU usage at the system (kernel) level.%iowait: Shows the percentage of time that the CPU was in an idle state while your system had outstanding disk I/O requests.%irq: Indicates the percentage of time spent by your CPU to service the hardware interrupts.%soft: Percentage of time spent by CPU to service the software interrupts.%steal: Shows the percentage of time spent waiting for a CPU while the hypervisor was servicing the other process.%guest: Indicates the percentage of time used by the CPU to run a virtual process.%gnice: Percentage of time spent by CPU to execute a nice guest.%idle: Shows the percentage of time that the CPU was in an idle state.
If the information is too much for your use case, just focus on two parameters: sys and usr.
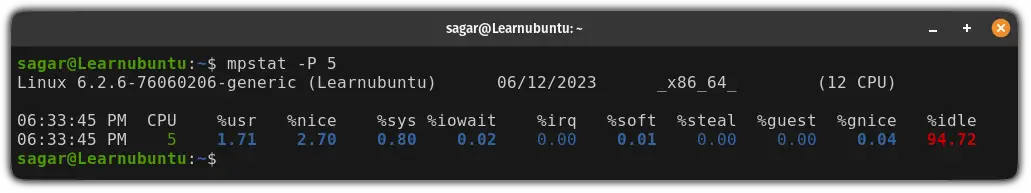
Similarly, if you want the same report but for a single core, you can use the -P flag in the following manner:
mpstat -P core_noFor example, here, I went for a report on the 5th core:
In a related topic, learn about getting GPU info in Ubuntu.

Historical CPU usage data
The above two tools show you the CPU consumption at the present time. What if you want to see the trend of CPU utilization over the past 24 hours? In that case, you can use other monitoring tools like atop, s-tui, glances etc.
 Ankush Das
You may also use an open source tool like Netdata to monitor your server infrastructure in a graphical way and save the data in the cloud. You can self-host it or use their service for free.

Hope you like this little tutorial.